Our Proven Results
Local Search Grid
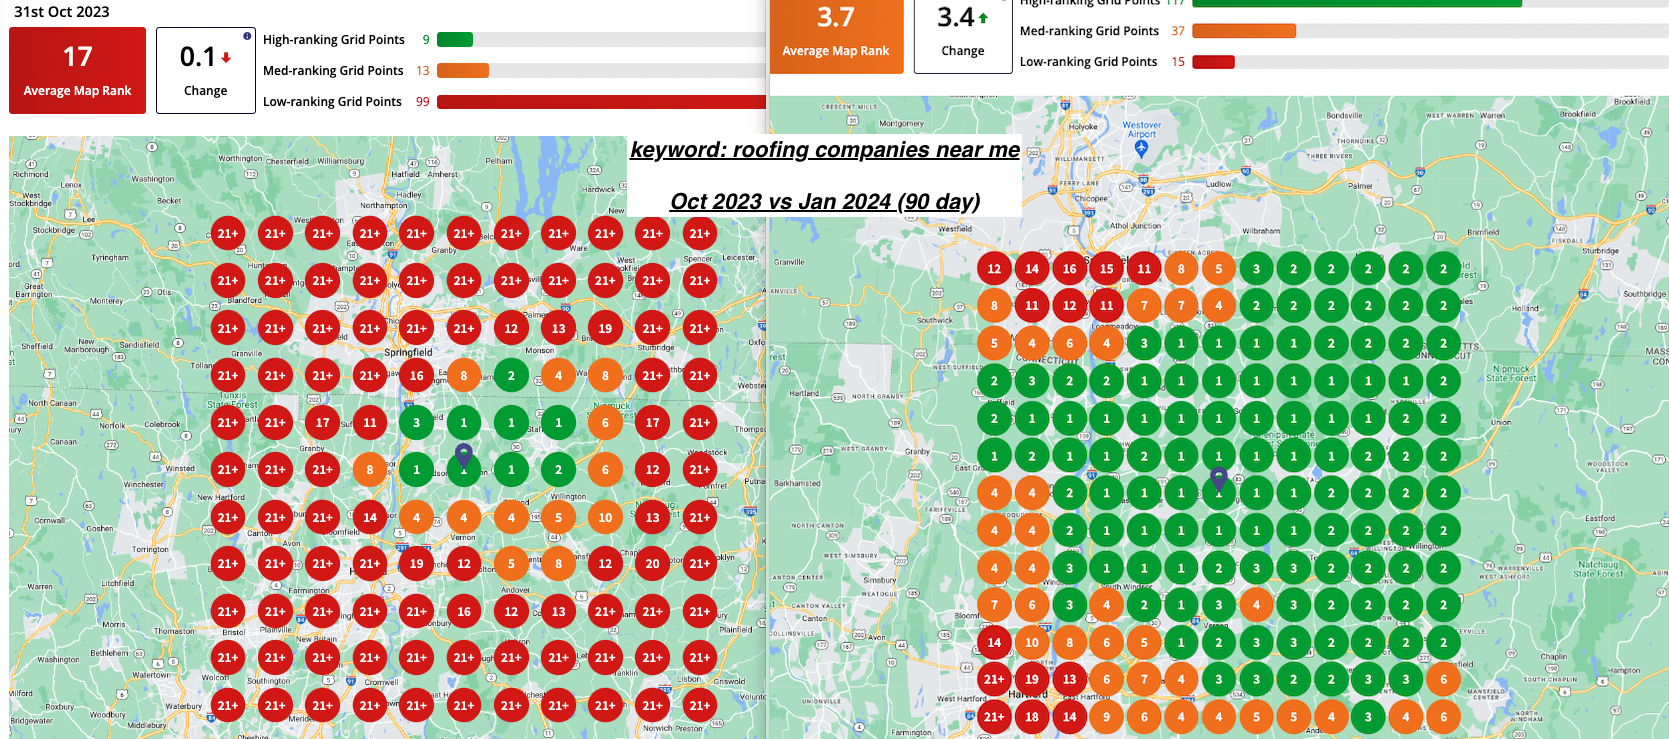
The following reporting shows a “search grid” over the individual client service areas. The Red bubbles represent rankings that are “11-21+” or page 2 of google and beyond. The orange bubbles represent ranking positions #4-10 on Google Maps, and the green bubbles represent top #1-3 rankings in Google Maps. Positions #1-3 are also known as the “3 pack,” which is the most sought after ranking position on Google.
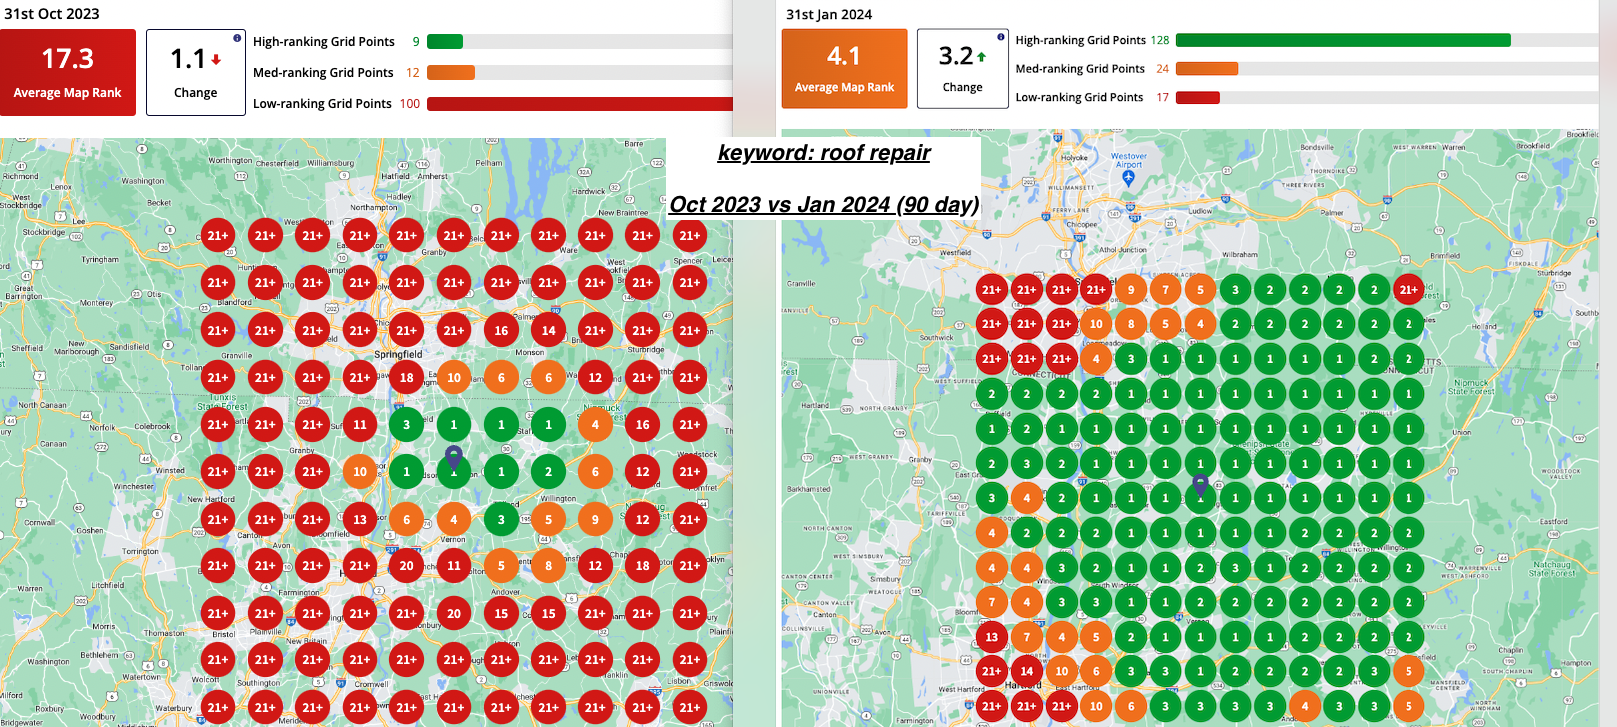
Roofing Company Oct 2023 vs Jan 2024
This roofer went from only ranking in their hometown, to top 3 rankings in several surrounding towns, now creeping into the metropolitan regions on the outer edges of the heatmap. Both examples shown are for highly competitive keywords “roofing companies near me” and “roof repair.”
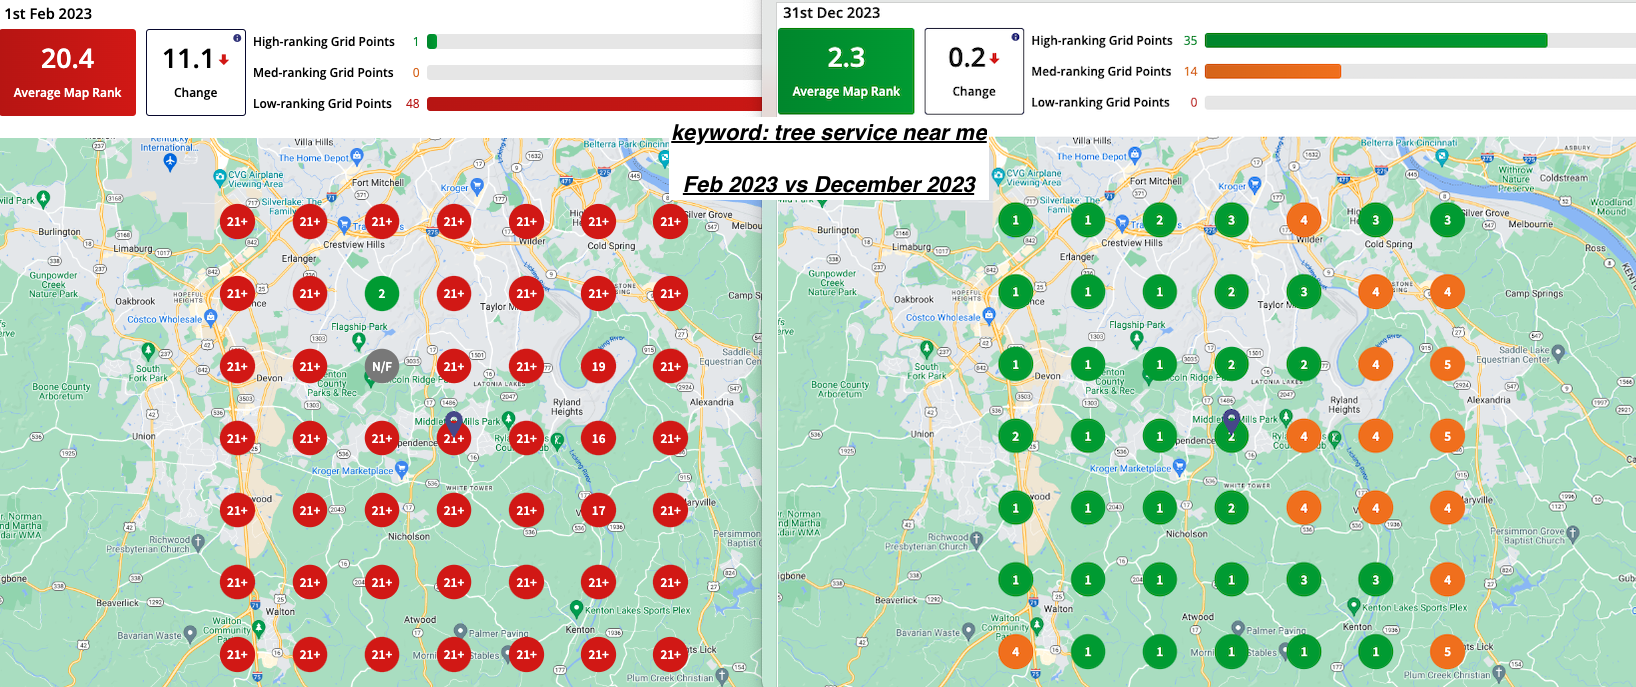
Tree Company: Feb 2023 Rankings Vs Dec 2023 Rankings
For the keywords “Tree service near me” and “tree removal service near me” this client went from almost all RED 21+ rankings to almost ALL top 3 rankings within 11 months!

HVAC Company: Feb 2024- April 2024
This client saw an enormously quick turn around within only 2 months of their new campaign launching. The Easyfish team created a specific “city page” strategy that aided in this quick turnaround in rankings. It is worth noting that this client has done an incredible job with reputation, and had already built some amazing 5-star reviews before they partnered up with us!

SEO Results:
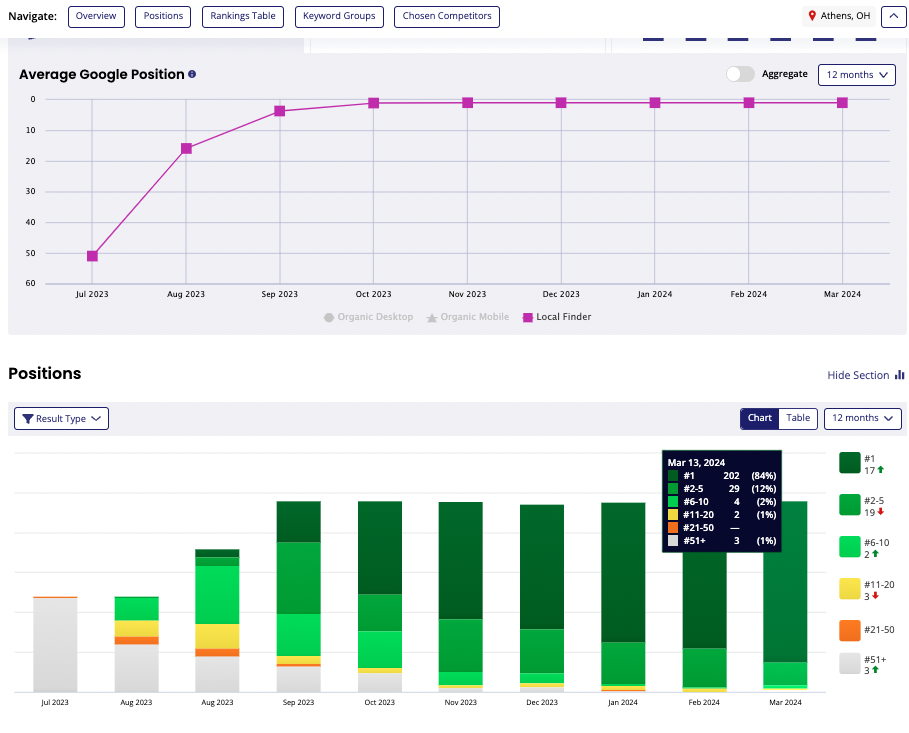
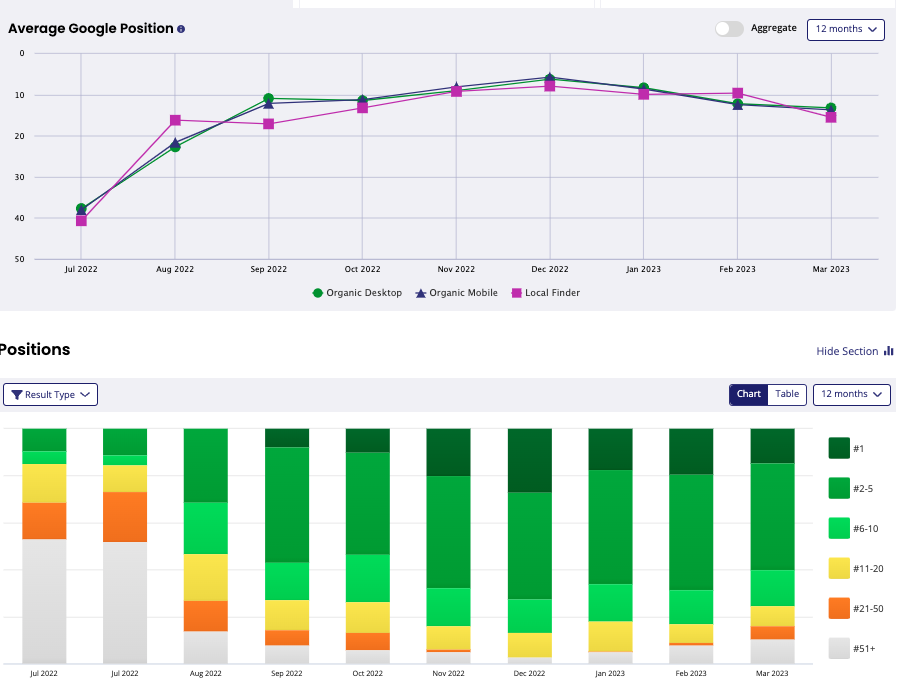
The Following Reporting Shows Google Rankings over time. The pink line represents Google Maps, the Green Line is Google Organic, and the Blue line is Google Mobile Organic. The Dark Green in the bar graphs represent keywords ranking #1, the medium green are keywords ranking from #2-5, the light green are keywords ranking #5-10, Yellow #10-20, Orange #21-50, and gray are rankings of 51+.
Tree Service: July 2023 - March 2024
This report specifically highlights the increase in rankings from position 51+ in Google Maps to the top 3 within appx 4 months. Not only did a few keywords hit top 3 rankings, but over 200 keywords went from position 51+ to the top 3!
Keep in mind, these kinds of results are only possible because in addition to the Easyfish marketing system, the client worked very hard and acquired over 25, 5-star reviews within that 4 month window; ultimately surpassing each competitor in the region.
Waterproofing Contractor: April 2023
When this client started with Easyfish Marketing, they had only 22 keywords in the top 2-5 spots on Google. they now have 42 #1 positions and 131 #2-5 positions on Google.
This client made these results possible by consistently communicating with our team and taking their 5-star-review acquisition plan seriously.
Our Phone Call Results:
These reports outline a 30-day website visit and phone call report, with additional data highlighting their google profile views. The red box outlines the phone call data.
Garage Door Contractor: Phone Call Report over 30 day timespan
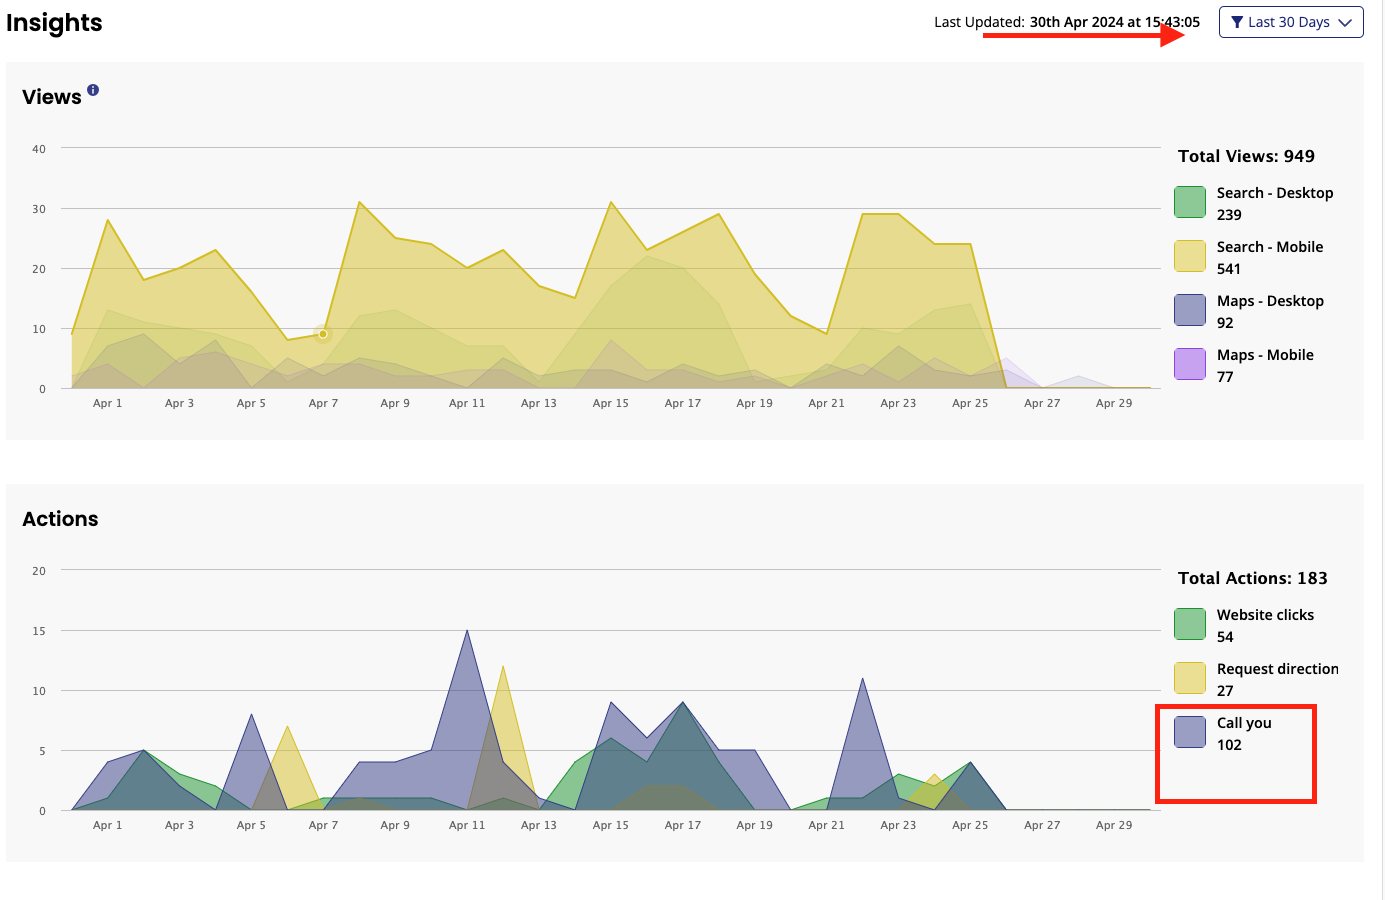
Septic Company: Phone Call Report over 30 day timespan
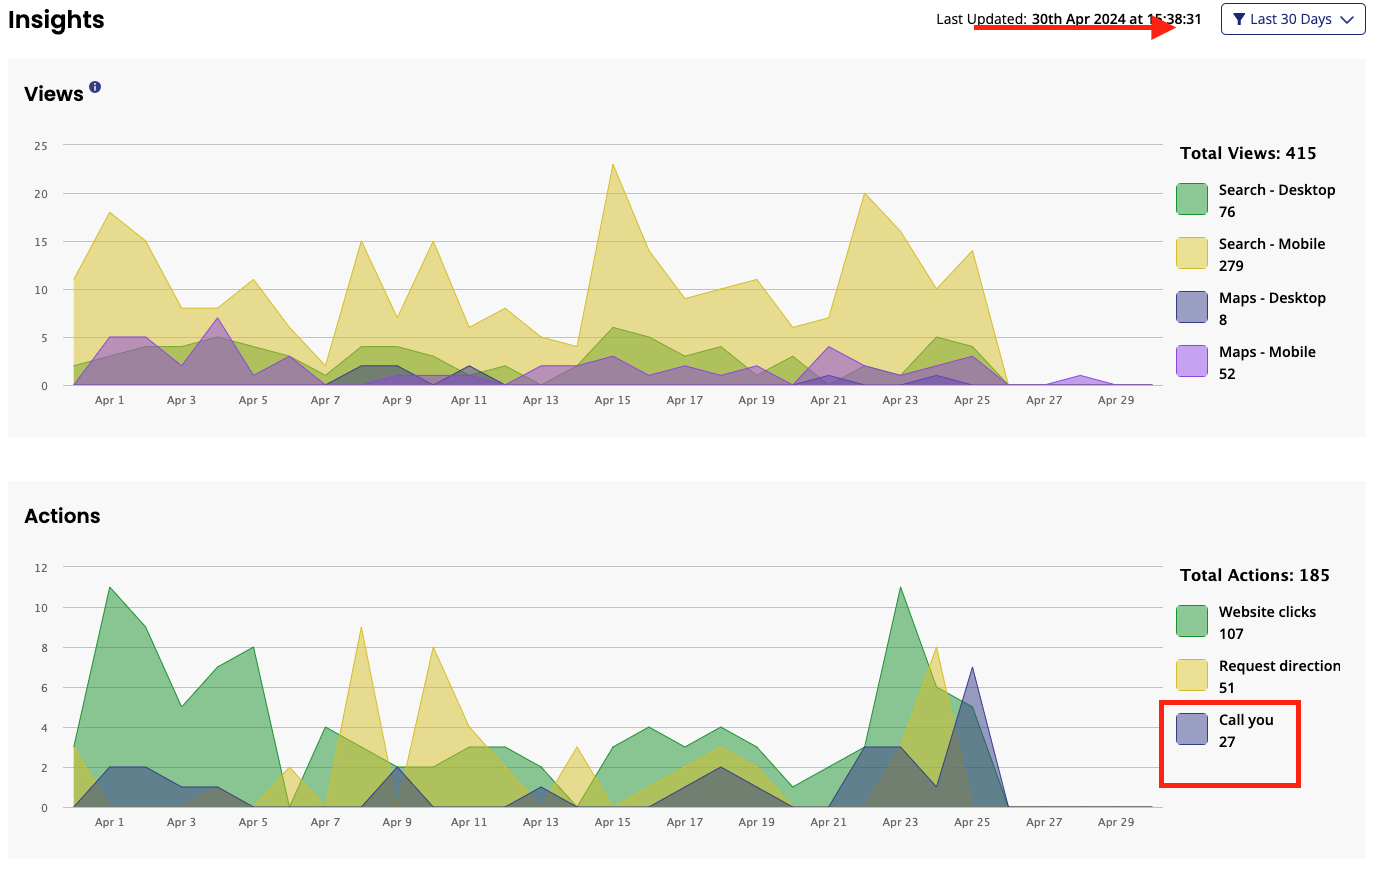
HVAC Company: Phone Call Report over 30 day timespan
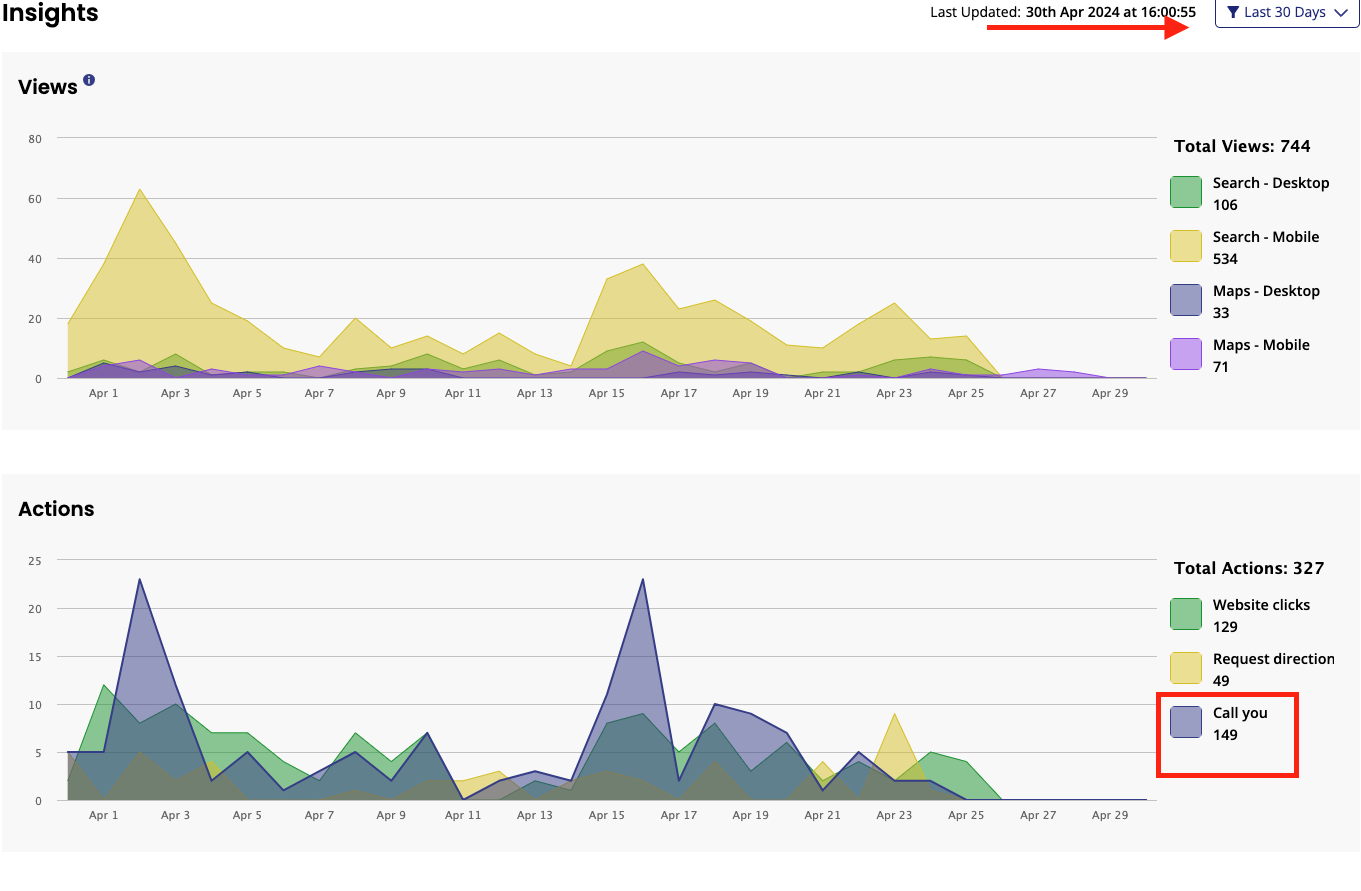
Roofing Contractor: Phone Call Report over 30 day timespan
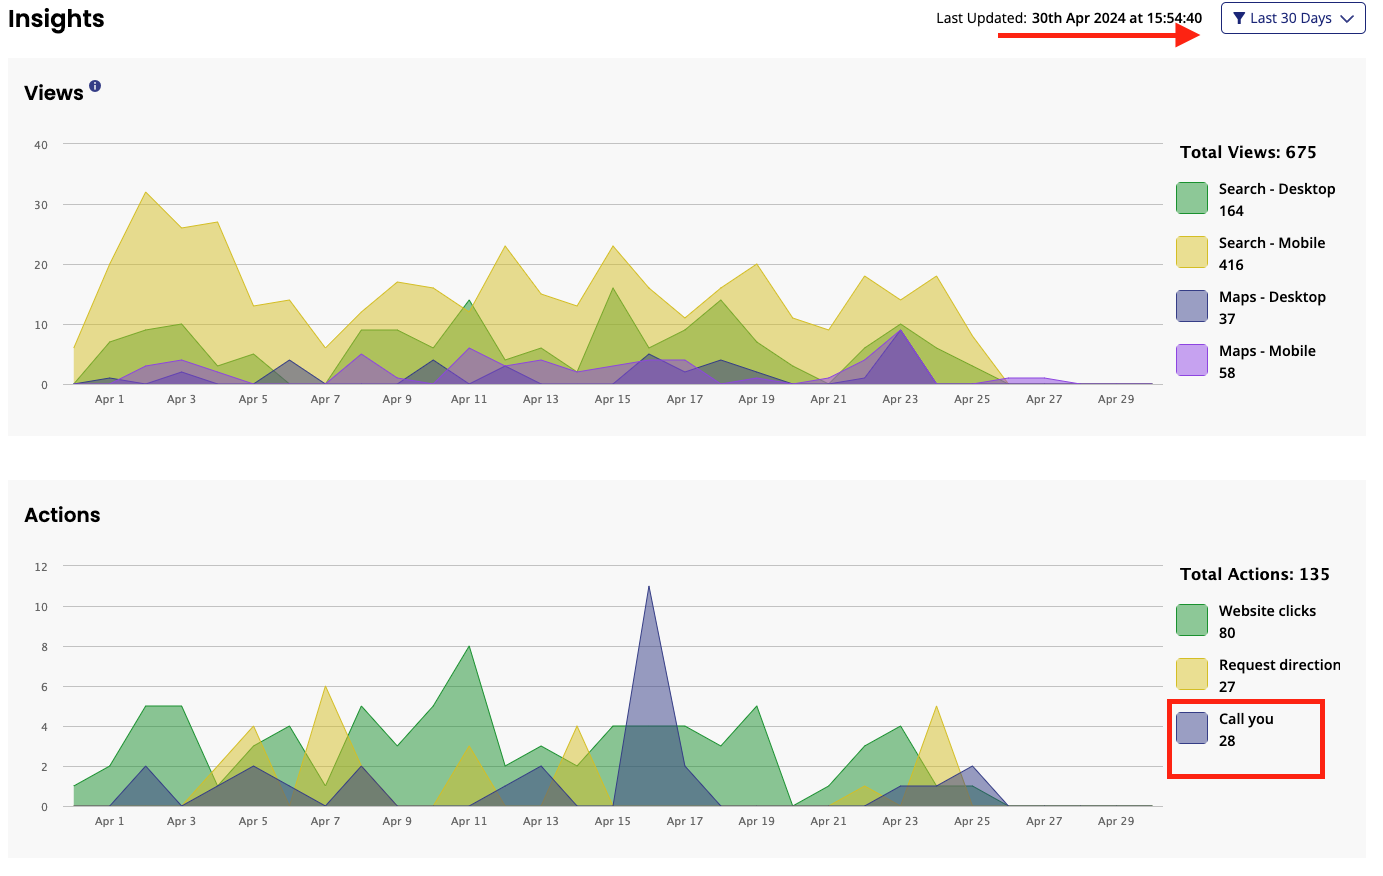
HVAC, Plumbing & Electrical Contractor: Phone Call Report over 30 day timespan

Ready to Elevate Your Online Presence?
Your small business deserves the spotlight. With Easyfish Marketing, that's precisely where you'll be. Don't just add content to your site; add value, authority, and engagement.